

Introduction
Getting the right registry and file settings for an application in Dynamic Environment Manager can be frustrating, especially when you’re working it out manually. Tracking down exactly where an app stores its preferences isn’t always obvious, and a bit of guesswork often leads to incomplete or messy configurations.
That’s where the DEM Application Profiler comes into play. Instead of digging through the registry and file system yourself, you can use this standalone tool to capture everything automatically. It monitors the application while you interact with it and builds a clean profile based on real usage.
Behind the scenes, the Application Profiler generates a Flex configuration file along with predefined settings that can be imported straight into Dynamic Environment Manager. You can review and tweak the captured data if needed, or simply drop it into your environment and start managing the application with confidence.
Profiler Machine
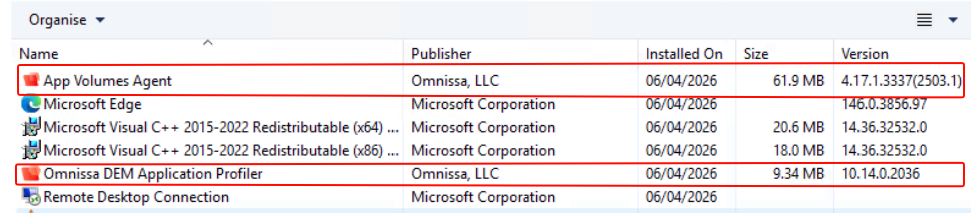
For the profiler VM, I like to keep things as close to my production VDI build as possible. In my case, that means basing it on the same gold image used in Omnissa Horizon, so the captured settings accurately reflect the real user environment. At a minimum, you’ll need the DEM Application Profiler installed, but beyond that I avoid layering in too much. Rather than installing applications directly onto the profiler VM, I prefer to install the App Volumes Agent and deliver apps the same way they’re presented in production. This approach keeps the capture process clean and consistent, and helps ensure the resulting DEM configuration behaves exactly as expected when rolled out.
At a high level, the following steps were performed:
- Install Windows 11 24H2 base OS
- Install Windows updates
- Remove MS Store Apps
- Run Horizon OSOT Optimize, Generalize and Finalize
- Join domain
- Install App Volumes Agent
- Install DEM Application Profiler
- Take snapshot
As you can see, no applications are installed other than the App Volumes Agen and the DEM Application Profiler
Begin Capture Process
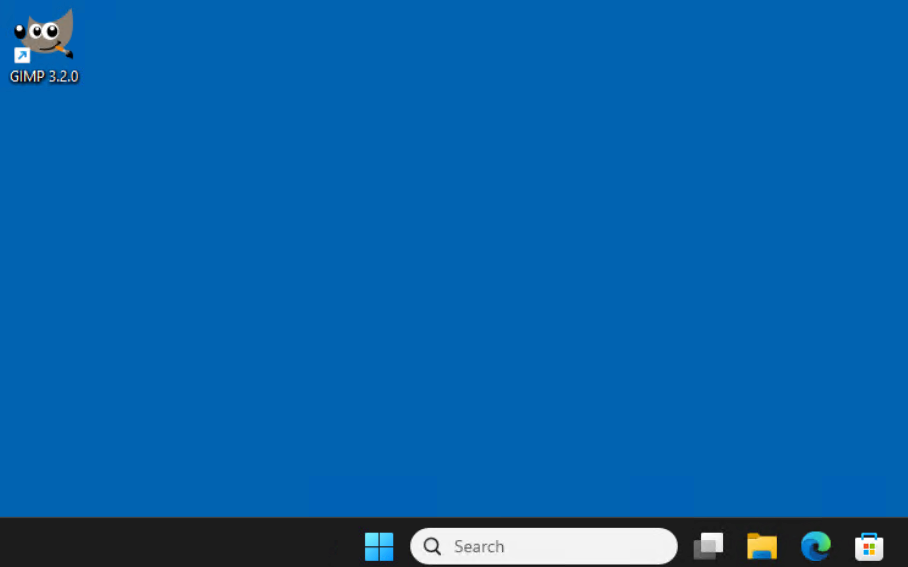
As the VM has the App Volumes Agent installed, I can log on with a user account that has the application I wish to profile assigned to it
The application we will be capturing is GIMP 3.2.0
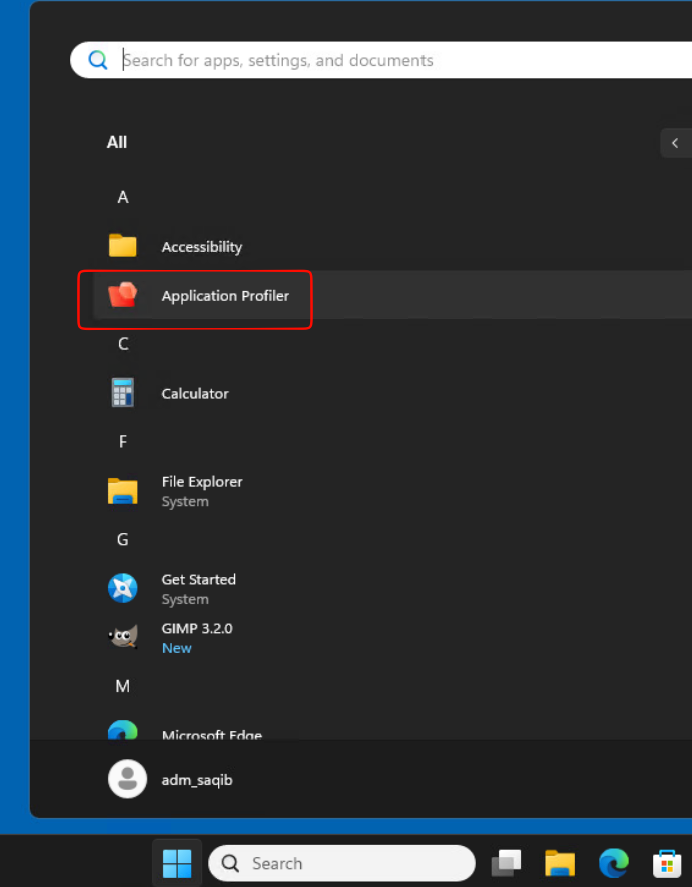
Start the Application Profiler
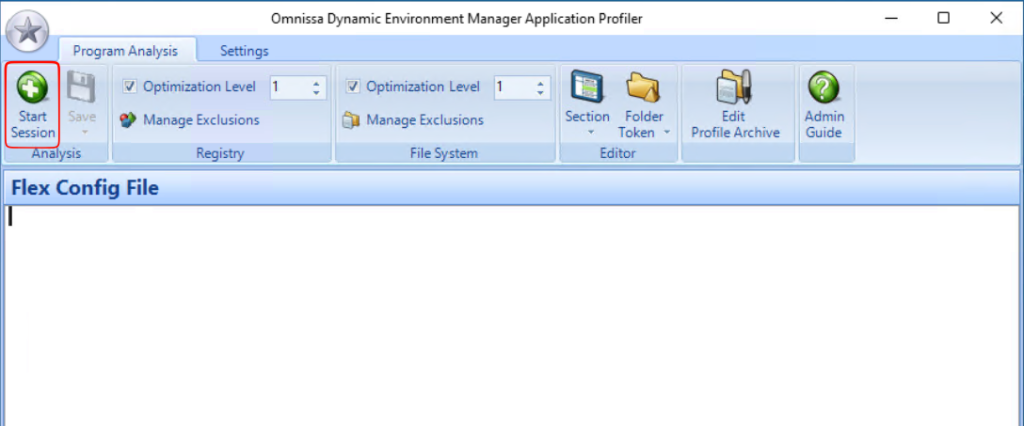
Next, click on Start Session
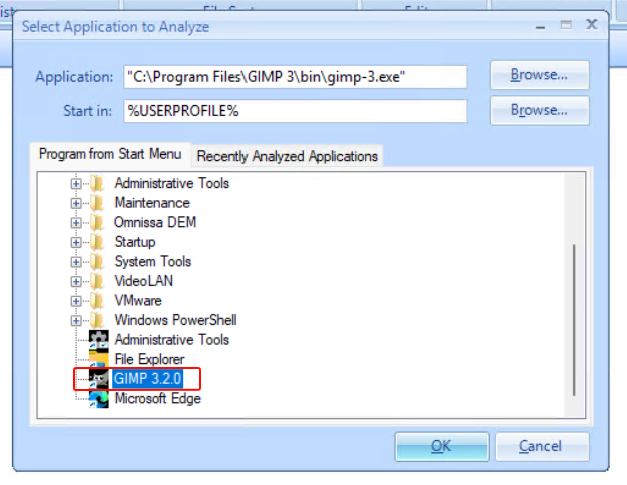
In the Select Application to Analyze box, you can find the application from the Start Menu. Select the application and press OK
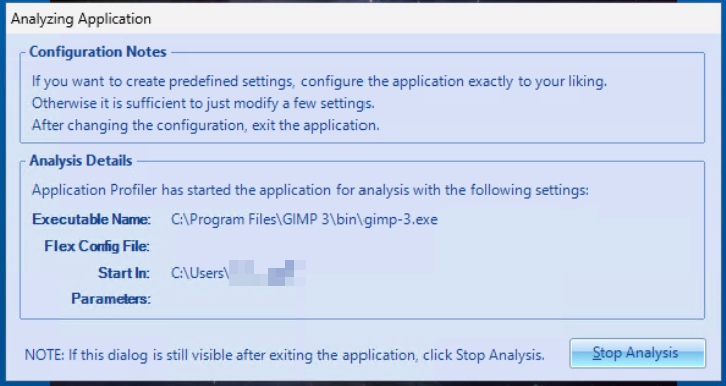
The following box is displayed while the application launches
Once the application is open, make a few changes.
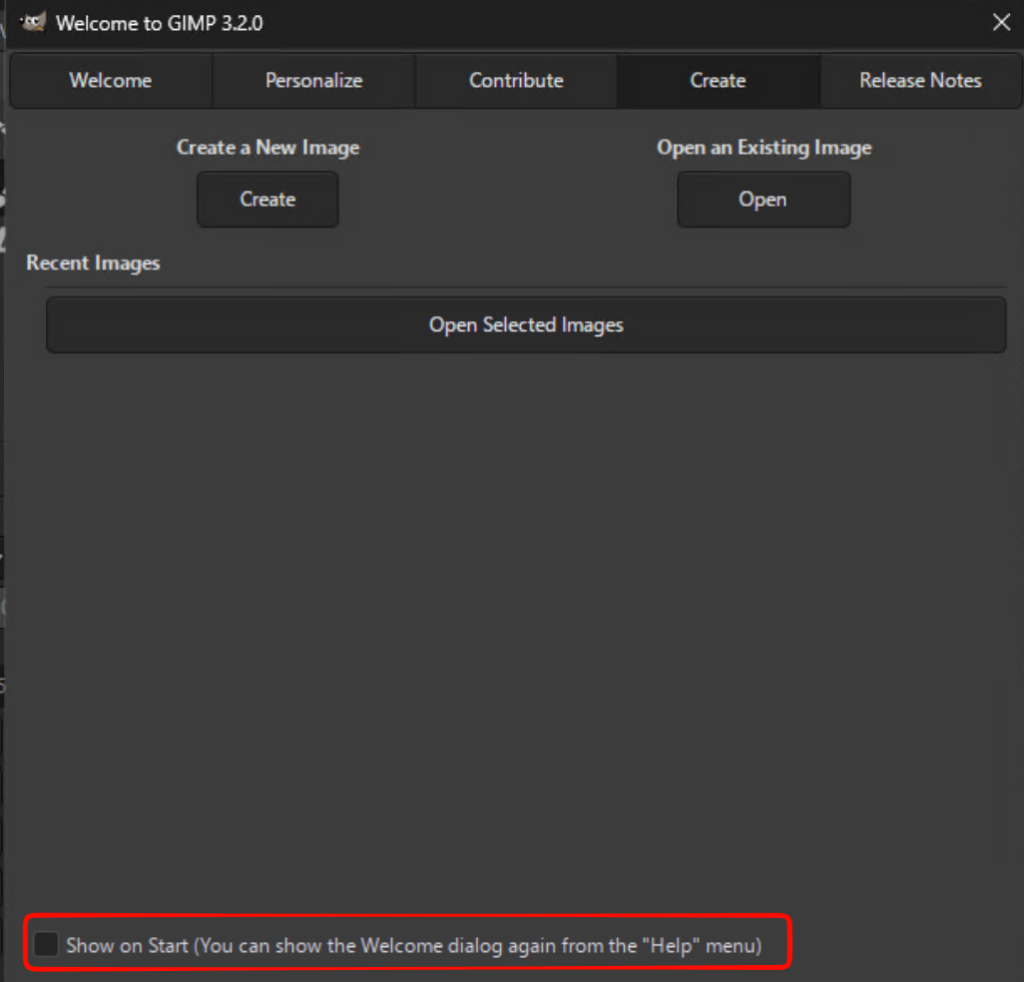
I disabled the start up box
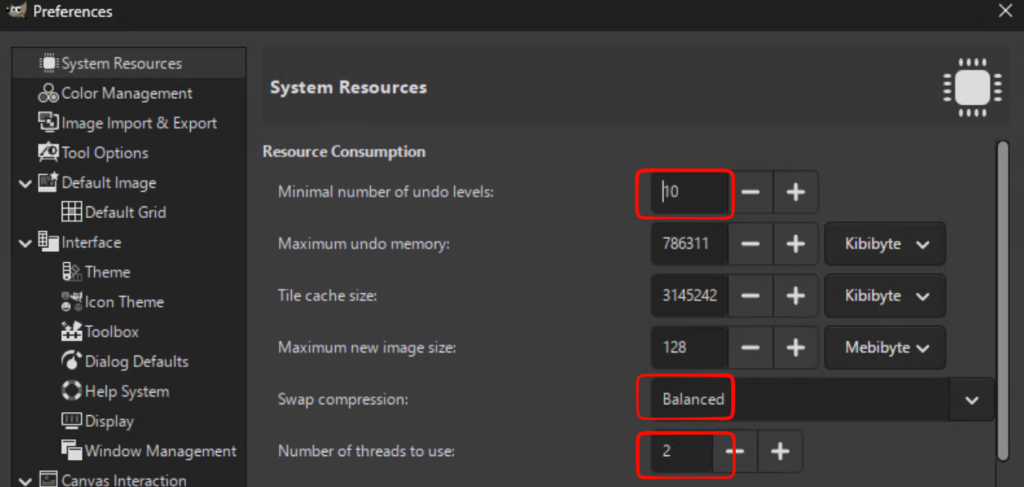
I also changed the following settings from the preferences menu
The application can now be closed.
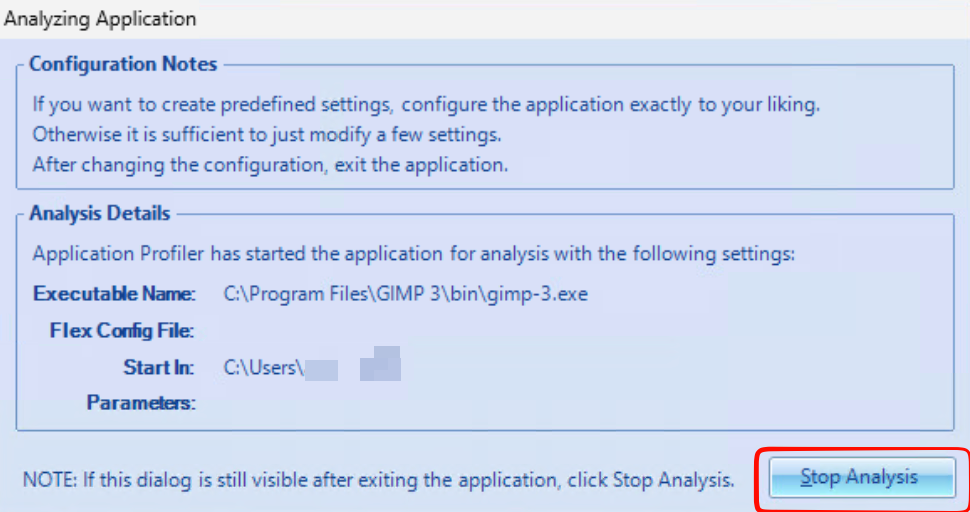
In my case, the following box is still displayed so I press Stop Analysis
Saving the Flex Config File
Once analysis is complete, the Flex Config file is created
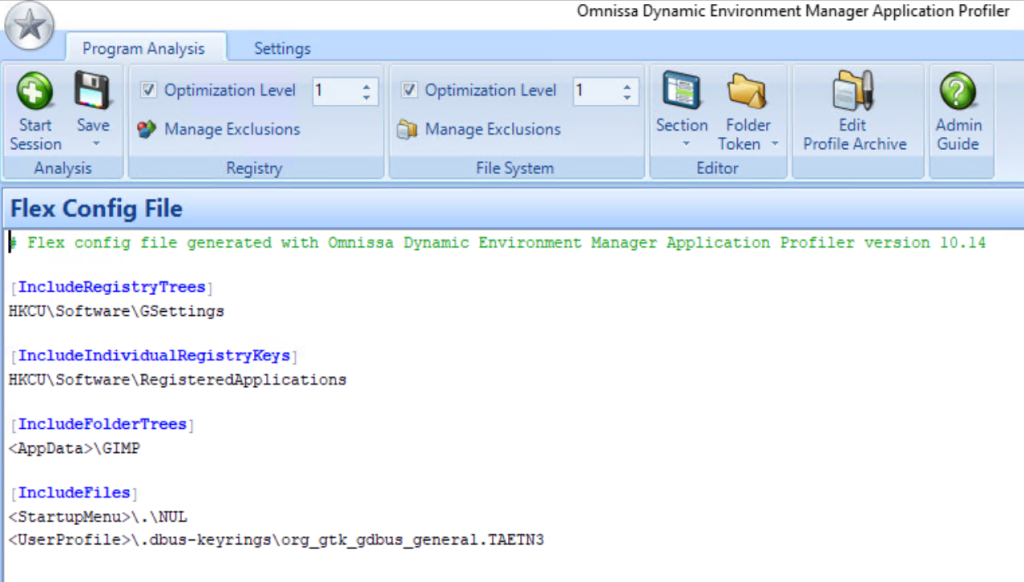
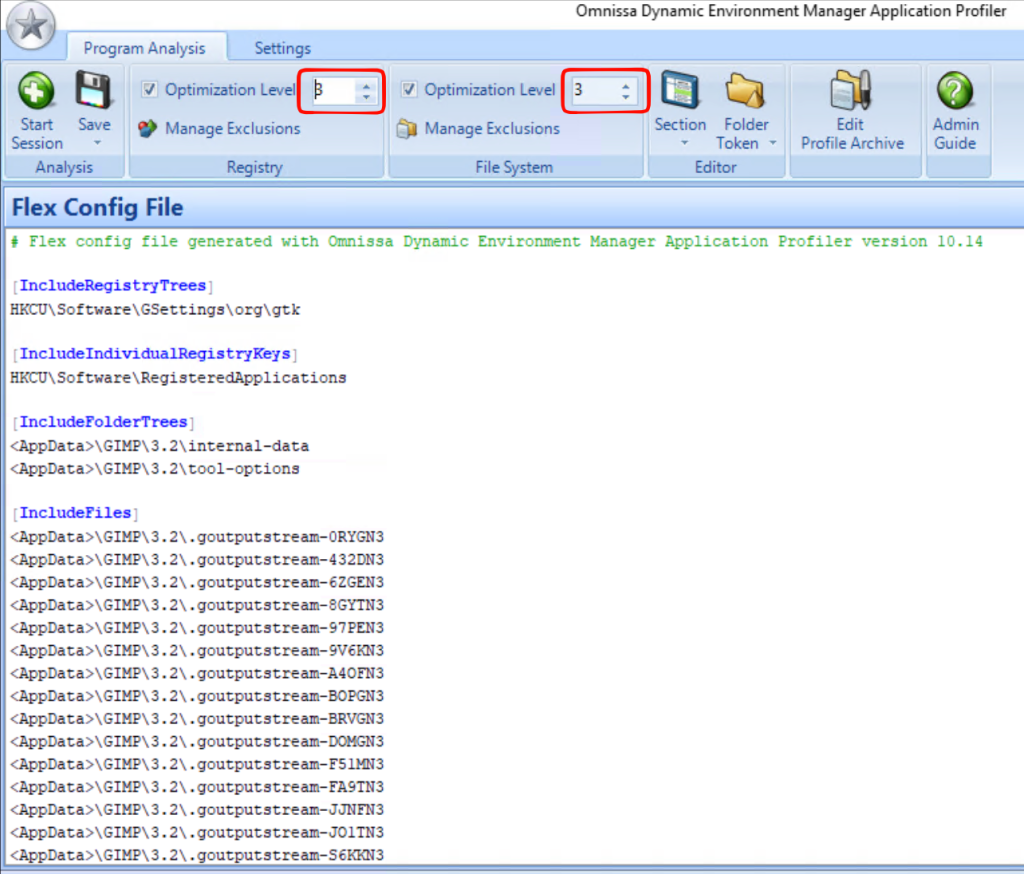
Furthermore, notice there is an Optimization Level setting for both the registry and file system. This controls how deeply the profiler expands the captured file system and registry paths. At lower levels, you get a high-level summary of where an application stores its settings. Bump it up to level 3, and you unlock a much more granular view — revealing subdirectories, nested paths, and folders that wouldn’t otherwise be visible.
Notice I now have more detailed info about the registry and file system locations which will be captured. This can also be useful to identify which paths you may want to exclude.
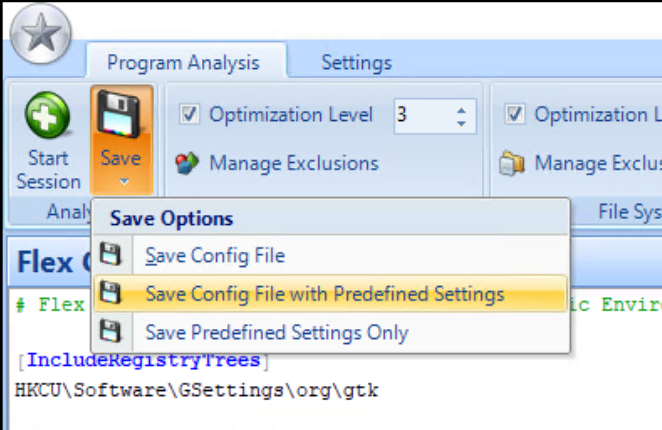
I won’t be making any further changes so I save the settings
I save it in a suitable location
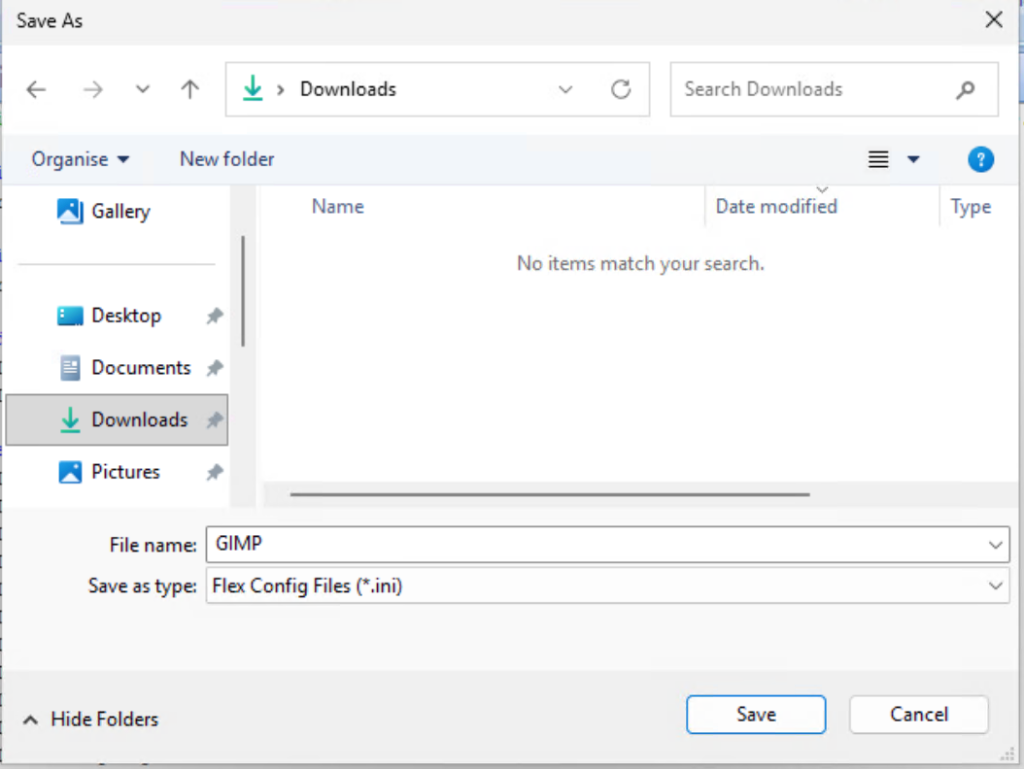
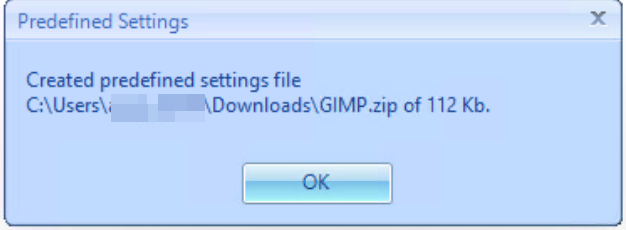
This is what you should expect to see
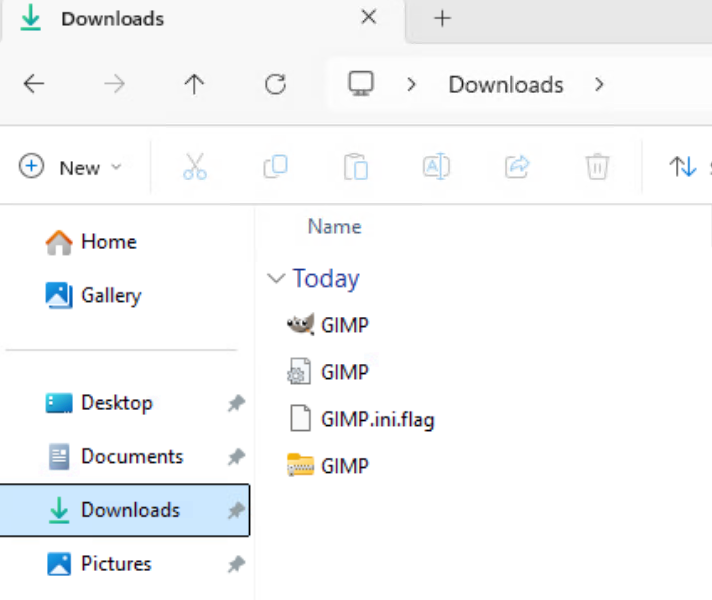
Copy the files to the Applications folder in your DEM config share
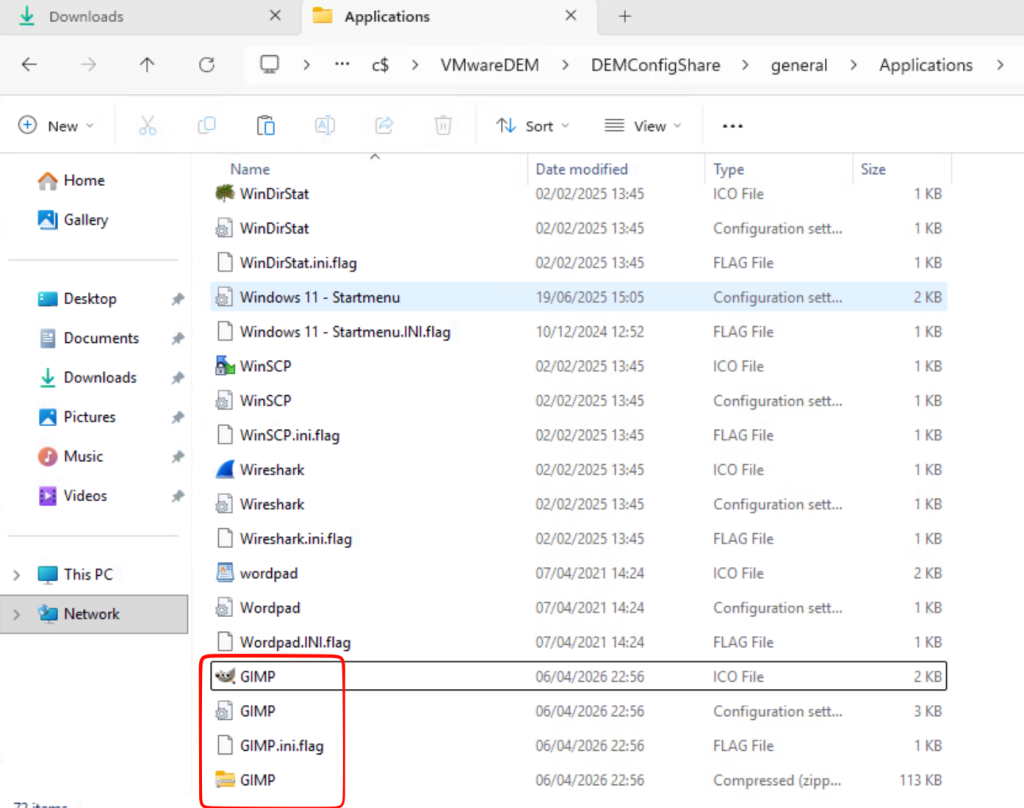
Next, connect to your DEM manager machine and launch the DEM console
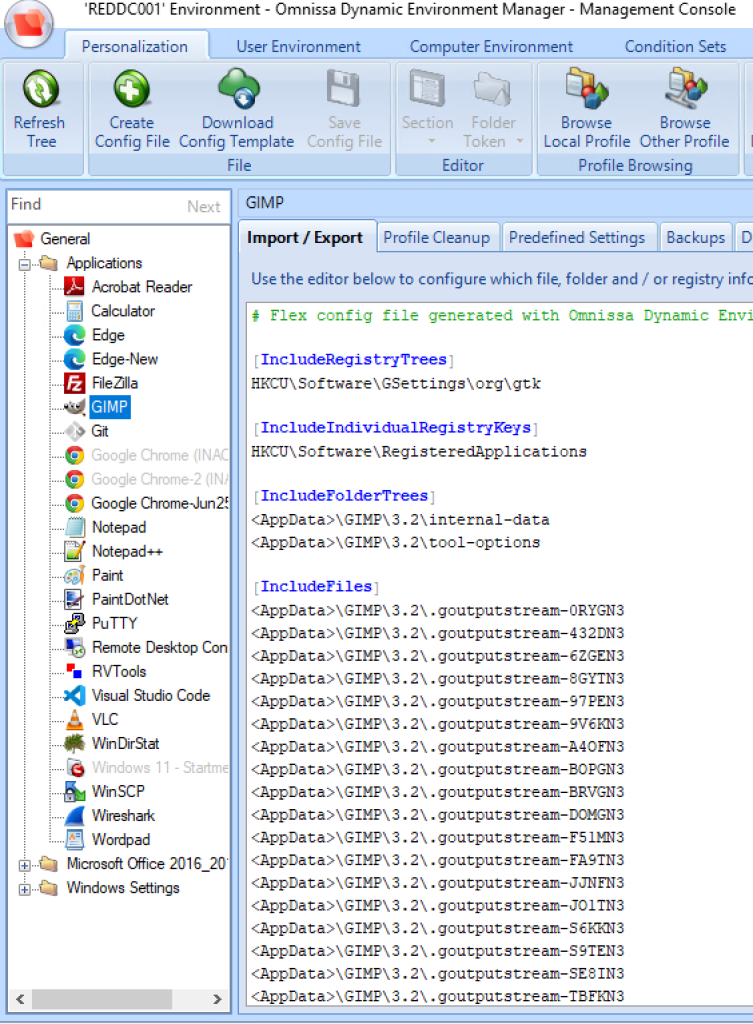
Expand the Applications folder, and we can now see GIMP listed along with the Flex Config we captured earlier
Tidy Up
Finally, you can restore the profiler VM back to the previous snapshot
Conclusion
At the end of the day, the DEM Application Profiler just makes life easier. Instead of digging through the registry and file system trying to figure out what an app is doing, you can capture everything by simply using the application as you normally would.
When your profiler VM matches your Omnissa Horizon build and apps are delivered via App Volumes, the results are consistent and predictable. You end up with clean Flex config files that are ready to go, with far less effort and guesswork. It’s a much quicker and more reliable way to get applications into Dynamic Environment Manager.
Sources:
https://www.vbrit.net/dem-fslogix/dem-application-profiling


thanks, worked for me.